Financial Ratio and Corporate Profile

1. Gross profit margin (%) = Gross Profit/ Revenue
a. Used to measure the profitability on products/services by comparing the gross profit (net sales – cost) against the net sales.
b. It should be aligned with the mark-up margin as imposed by the Company.
c. Ideal scenario: This will vary by business and industry. Generally, more than 40% indicating Company has the ability to manage its cost effectively.
2. Net profit margin (%) = Profit Before Tax/ Revenue
a. Used to measure the profitability on business by comparing the net profit against the net sales.
b. All expenses including interest will be taken into consideration in deriving the net profit.
c. Ideal scenario: Consistently growth in net profit for Company, 10% considered average while 20% and above considered high (or good).
3. Current ratio (x : y) = Current assets : Current liabilities
a. Used to determine if the Company will have enough capital to cover all the current liabilities.
b. Ideal ratio is 2:1. Although this will vary by business and industry, a number above 2 may indicate a poor use of capital. A current ratio under 2 may indicate an inability to pay current financial obligations with a measure of safety.
4. Working capital (RM) = Current assets – Current liabilities
a. Used to measure balance of working capital for Company after deducting all the current liabilities.
b. Ideal scenario: Positive working capital indicating Company has the ability to pay current financial obligations with a measure of safety.
5. Gearing ratio (%) = Debt/ Networth (Equity)
a. Used to indicate how much debt used to finance the business by comparing against net worth/equity.
b. Ideal scenario: Less than 50% indicating Company is in good financial shape to manage its debt.
6. Return on equity (%) = Profit before tax/ Networth (Equity)
a. Used to measure % of return for every single RM invested into the Company.
b. Ideal scenario: ROE consistently at 15% and above indicating Company has the ability to deploy its investors’ funds effectively.
7. Cash flow = Cash flow/ Profit Before Tax
a. Used to measure % of cash flow for Company by comparing the amounts earned in profit.
b. Ideal scenario: Ideal ratio is 100%. If lesser than 100% meaning Company takes in less cash and cash equivalents than what it earns in profits.
8. How to define healthy of a Company through Corporate Profile through 5 alerts:

Alert 1: Status

The company must be showing “existing” and if your saw “winding-up” means the company is already unable to perform as a business entity.
Alert 2: Share Capital

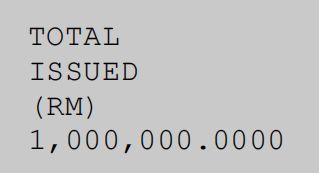
The amount of investment by the Directors and if you see a RM 2.00 investment means the Company is technically an empty company.
Alert 3: The Directors
![]()
Are the Directors that you know are the registered Directors inside the Company and if not, the Directors are not genuine.
Alert 4: Financial Information

Ensure the tabling dates are up to date, financial strength (profit, assets and liabilities). Whereas if the tabling dates are not updated means the company is not being audited and the financial information are not updated.
Alert 5: Company Charges

To check if the Company is active through financial charges with banks and if it’s clean, means the Company is dormant or an “empty” company.
It is to advise that to understand the Company’s Corporate Profile at https://www.mydata-ssm.com.my/login for avoiding any disappointment.
Remarks:
1. Want to know your company’s health? Click on the calculator link below to find out;
2. The written article is for general understanding and do connect with your respective COSEC for further understanding.
